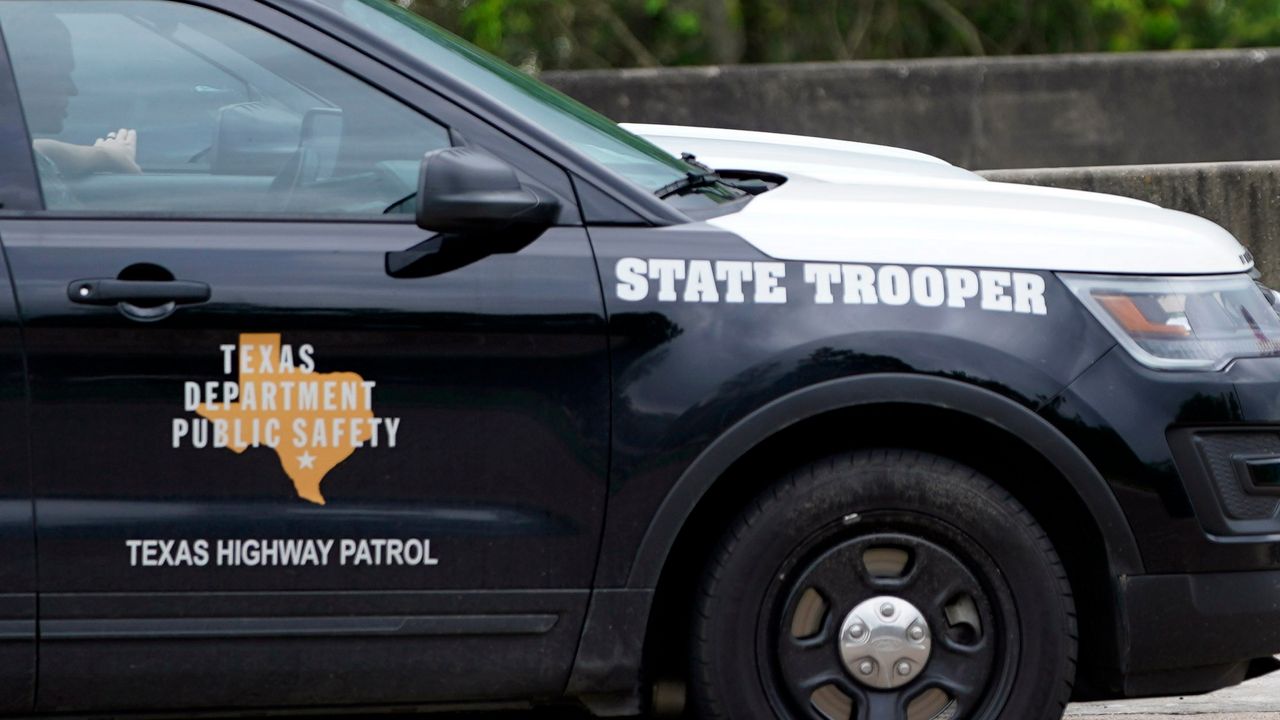
AUSTIN, Texas — A partnership between the Austin Police Department (APD) and the Texas Department of Public Safety (DPS) resumed on July 2. The City of Austin put out some new data that surveyed each council district’s traffic collision records and emergency response times while DPS was deployed earlier in 2023.
For the sake of transparency, the City of Austin is committing to providing regular updates regarding the direction of the partnership. Throughout all of this, APD wants to show it's “actively listening to concerns and feedback from the mayor and City Council and community members related to the partnership with DPS.”
The partnership between APD and DPS may have initially been announced on March 27, 2023, however, a mid-May pause to the union halted DPS resources. The data compares the dates April 2, 2023, to May 13, 2023, after DPS deployment, and Jan. 1, 2021 to March 25, 2023, before DPS deployment.
“The core goals of the partnership are to reduce APD response time to Austinites placing 9-1-1 emergency calls for service, to reduce incidents of violent crime, and to reduce the number of fatal and injury crashes on our roadways,” reads its mission overview via City of Austin.
According to the City of Austin, these past several years, there’s been record numbers of traffic fatalities. So, DPS stepped in to help APD secure the city’s roadways in areas experiencing the most serious traffic accidents and lower the number of collision fatalities and injuries.
The highest number of crashes without fatality during DPS deployment go to District 2, while District 3 has the highest number of fatal collisions.
Data showing emergency response times before and during DPS is proof of a decrease between then and now. Partnering with APD, DPS has been responsive to calls that are either violent or have the potential to be violent. DPS focused on areas with the highest number of calls for assistance.
With over 3,700 citywide calls, District 3 was reported to have the most calls at 555. But its response time is the shortest among any of the other districts.
Council District 1
- Response time before DPS deployment: 9:39
- Response time during DPS deployment: 8:48
Council District 2
- Response time before DPS deployment: 9:24
- Response time during DPS deployment: 8:33
Council District 3
- Response time before DPS deployment: 8:17
- Response time during DPS deployment: 7:08
Council District 4
- Response time before DPS deployment: 8:46
- Response time during DPS deployment: 7:52
Council District 5
- Response time before DPS deployment: 9:04
- Response time during DPS deployment: 8:32
Council District 6
- Response time before DPS deployment: 11:07
- Response time during DPS deployment: 10:17
Council District 7
- Response time before DPS deployment: 10:04
- Response time during DPS deployment: 9:12
Council District 8
- Response time before DPS deployment: 10:28
- Response time during DPS deployment: 10:15
Council District 9
- Response time before DPS deployment: 7:47
- Response time during DPS deployment: 7:15
Council District 10
- Response time before DPS deployment: 11:06
- Response time during DPS deployment: 9:32
This new set of data reflects the positive that has come out of the partnership between APD and DPS. "APD and City management are encouraged by the initial set of data which shows that during the time DPS was deployed with APD there were citywide reductions across multiple categories including emergency calls for service, patrol response times, and reported incidents of violent crime," per City of Austin.


