

In most years our Winter Weather Forecast Special airs all throughout Thanksgiving weekend, however in the time of COVID we won’t be able to this year.
Don’t worry though as here’s our winter 2020-21 forecast along with the formula we put together more than a decade ago to help in our prediction.
Last year we were one of the few outlets, local or nationally, that forecasted the mild and below average snowfall winter that ultimately came to fruition. We’ll use that same method again this year.
There are three main teleconnections we look at, ENSO, Eurasian snow cover, and the NAO. We’ll compare what we’re expecting out of these teleconnections this year to past years to find similarities. That will give us our analog years where we’ll whittle down ultimately to a forecast.
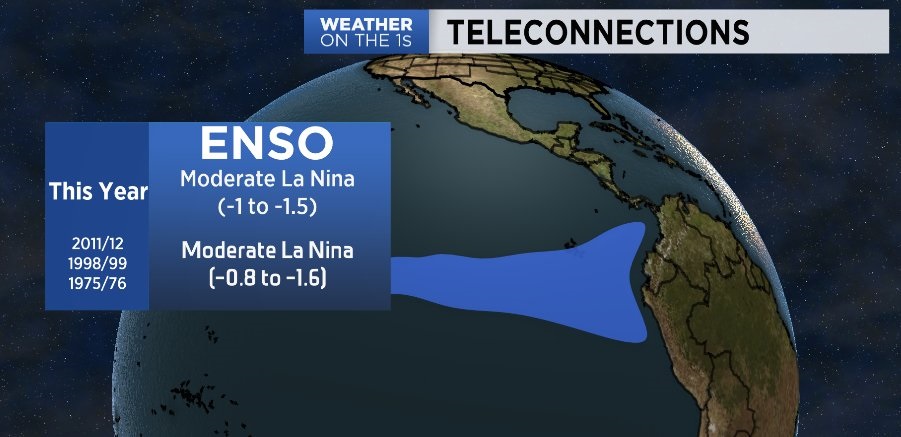
We’ll start with ENSO, which stands for the El Niño Southern Oscillation. This is where we look to see if the waters along the equatorial Pacific are running above or below average. If above its called El Niño and if below it’s called La Niña.
This year we’re expecting a moderate La Niña where surface water temperatures are running around 1 degree to 1.5 degrees below average. Some of our analog years where we had a moderate La Niña are 1975-76, 1998-99, and 2011-12.
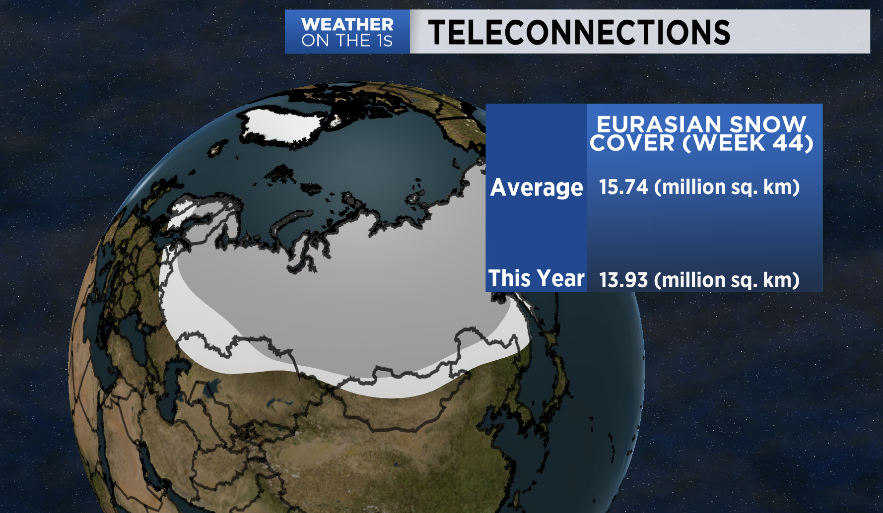
Now we’ll take a look at what Eurasian snow cover is doing going into this winter at week 44. This is another comparable reading and also lets us know if early season super cold air masses can be generated.
Eurasia is where most of the Northern Hemispheres super cold air masses begin. On average, there is about 15.74 million sq. km of snow cover across Eurasia at week 44. This year there is only 13.93 million sq. km.
That tells us the odds of having a super cold outbreak are smaller than average for the beginning of the season.
One thing that I’ve noticed over the years while producing our winter forecast is that when in a La Niña year, such as this, the NAO is king.
The NAO stands for the North Atlantic Oscillation. There are two semi-stationary areas of pressure across the North Atlantic. There’s the Icelandic Low and the Azores High.
When these areas of pressure are running stronger than average we have a positive NAO, and when they’re weaker than average, it’s called a negative NAO.
Now the NAO does change on a day by day and week by week basis but we can still get an overall trend and idea what state it will be in the majority of the time.
The reason for the NAO to have such an influence is that it’s also a good reading for how strong the jet stream is traveling across the Atlantic Ocean.
If the NAO is positive, that means a stronger than average jet stream and less chance for any kind of blocking pattern across the Eastern Seaboard. This would prevent cold air intrusions and locked in patterns of cold.
If the NAO is negative, the opposite is true. There will be a weaker jet and a more likely chance for a blocking pattern of cold air across the east.
This is where the whittling really begins. The winter of 2011-12 had a very positive NAO index of 1.37. We’re expecting a similar NAO this season, very positive.

Numerous weather models are forecasting this positive NAO. In both the Euro and CFS models you can see in the picture below the dark blue near Iceland. That would be a stronger than average Icelandic Low.
The orange in the central Atlantic would represent a stronger than average Azores High. Both areas of pressure are stronger than average, hence the postive NAO.

There are other auxiliary teleconnections we can look at such as the AO (Arctic Oscillation), the PNA (Pacific North American Pattern), and the MJO (Madden-Julian Oscillation).
However, I’ve found out that the three mentioned above have a larger impact in our winter weather patterns.
Now that we’ve analyzed our teleconnections and whittled down our analog years with similar such readings, here is our prediction for winter 2020-21.
To be statistically accurate, anything within 2 degrees of the average temperature is considered average, and anything within 5 inches of the average snowfall is considered average.
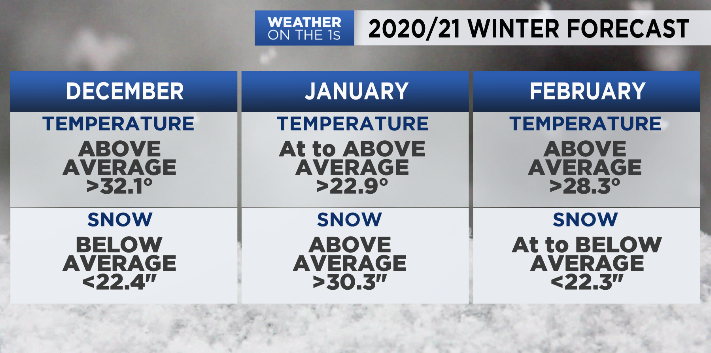
After experiencing, as of this writing, one of the warmest Novembers in recorded history, much of the same is expected in December. The average temperature for December is 30.1 degrees. We’re expecting above average temperatures greater than 32.1 degrees.
Snowfall also looks to finish below average. December is typically our snowiest month averaging 27.4 inches. We’re expecting less than 22.4 inches. Overall when it comes to winter weather, December will see less than usual.
If there is one month where winter comes on strong that would be January. While we’re not expecting any sustained cold, temperatures will be closer to average. The average monthly temperature for January is 24.9 degrees.
We’re forecast at to above average temperatures, so warmer than 24.9 degrees. With the colder air and Lake Erie still open for business when it comes to lake-effect, we’re expecting quite a bit of snow.
In fact, we’re forecasting above average snow, which is greater than 30.3 inches. The average snowfall for January is 25.3 inches. This is also the month where there’s potential for a blockbuster storm or two, so winter weather fans rejoice.
However, winter once again relaxes in February. The average temperature for February is 26.3 degrees, and our above-average temperatures are expected to return. We’re forecasting the monthly average temperatures to be greater than 28.3 degrees.
Snowfall is expected to be at or below average. We average 17.3 inches of snow in February, and this year we’re expecting less than 22.3 inches.
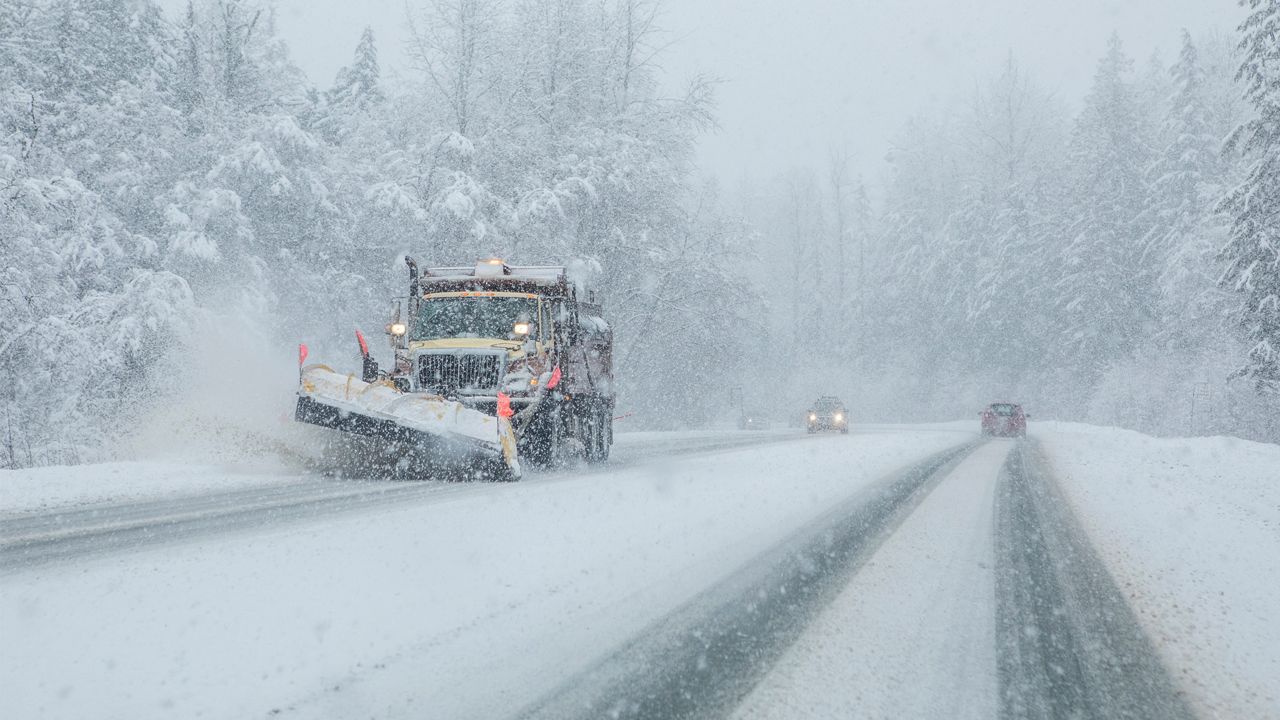
Overall, it will be a warm winter with below-average snowfall. However, it is still Western NY and we’ll still get our fair share of winter weather, especially this year during the month of January.
Also remember this is more of a trend than a single day prediction here or there and there’s always the potential for that rogue system to show up and dump all kinds of snow on us. If that happens we’ll be here providing you with the latest information.
Please feel free to reach out to me on Twitter @Dan_Weather_Man or email me at dan.russell@charter.com for any additional questions.
Have a happy, safe, and healthy winter of 2020-2021!