


Our winter weather outlook is back. And this season looks to bring a bit of everything, which should please both the "snow hounds" and the "winter haters" of our community.
Our formula, which we’ve been using since 2008, continues to provide accurate results.
Let's look back at the winter of 2020-2021. Using our methodology, we called for a warm winter with below-average snowfall. Low and behold, we nailed it. While temperatures were average one month, two months ended up with above-average temperatures. Additionally, we saw less snow as well. Only 77.2 inches of snow was recorded all season long, which is below average.
So, what tools do we use to come up with our outlook? Three main teleconnections come to mind: the El Niño Southern Oscillation (ENSO), Eurasian snow cover, and the Northern Atlantic Oscillation (NAO).
Comparing the data we have now with past years and predictions, we seek out similarities and come up with an analog year that compares favorably to the current year. When coming up with an outlook for this winter using those methods, we noticed similar trends for the 2005-2006 winter season.
ENSO, which is a recurring climate pattern involving surface water temperatures along the equatorial Pacific. It consists of three main phases known as El Niño (warm phase), La Niña (cool phase) and a neutral phase. Depending on what phase we are in, we can make calculated assumptions on how our weather will be impacted during a given timeframe.
This year we’re expecting a weak to moderate La Niña, where surface temperatures will be running 0.5 to 1.3 degrees below average. In 2006, the equatorial Pacific surface water temperatures were running 0.9° below average. We’ve had similar La Niña conditions in other years, but that’s where the other teleconnections come in.

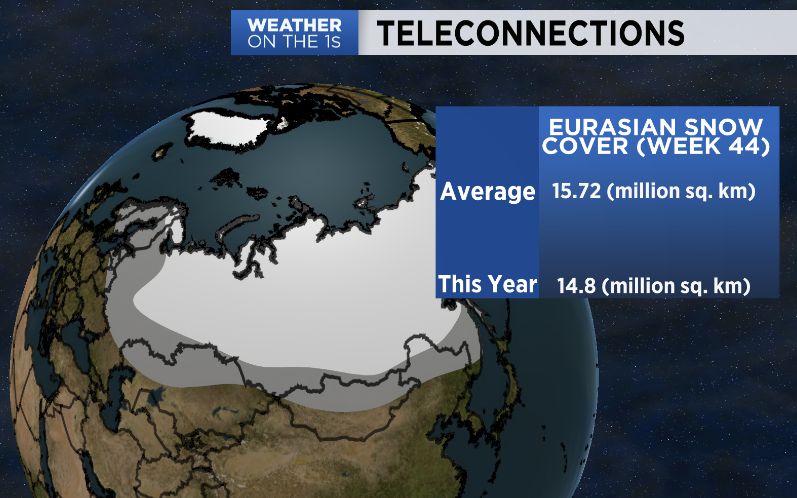
Looking at what Eurasian snow cover is doing at week 44 during the winter months is a good indicator of whether or not early season cold outbreaks are possible given that is where most of the super cold air masses originate in the Northern Hemisphere.
On average, snow covers nearly 15.72 million square kilometers of Eurasia at week 44. This year we weren’t too far from average with 14.8 million square kilometers of snow cover, which also compares nicely with week 44 back in 2005, where there were 14.86 million square kilometers of snow cover.
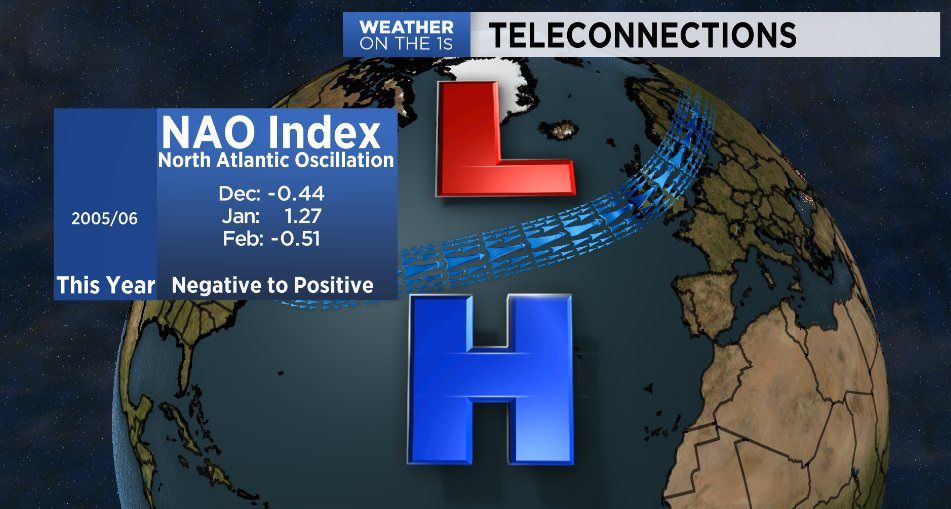
Our last teleconnection, the NAO, proves to be an essential tool when determining what our winter season will look like, especially during La Niña years.
This climate pattern involves two semi-stationary areas of pressure across the North Atlantic: the Icelandic Low and the Azores High.
When these areas of pressure are running stronger than average we have a positive NAO, and when weaker than average, a negative NAO.
The reason for the NAO to have such an influence on our weather is because it lets us know how strong or weak the North Atlantic jet stream will be.
If the NAO is positive, we can expect a stronger than average jet stream and less chance for any kind of blocking pattern to set up, preventing intrusions of Arctic air and prolonged periods of colder than average weather, thus favoring a milder winter.
If the NAO is negative, the opposite is true. There will be a weaker jet with better chances for blocking and slower-moving storms.
In December of 2005, the NAO was negative resulting in an average temperature of 4.3 degrees below average. However, the following month, the NAO went positive and temperatures averaged 9.6 degrees above average, making it the fourth warmest January on record. The NAO then went back to being slightly negative in February with temperatures trending closer to average.
According to the European Model and other long-range forecasting models, we’re expecting the NAO to trend more negative in December and more positive in January and February.
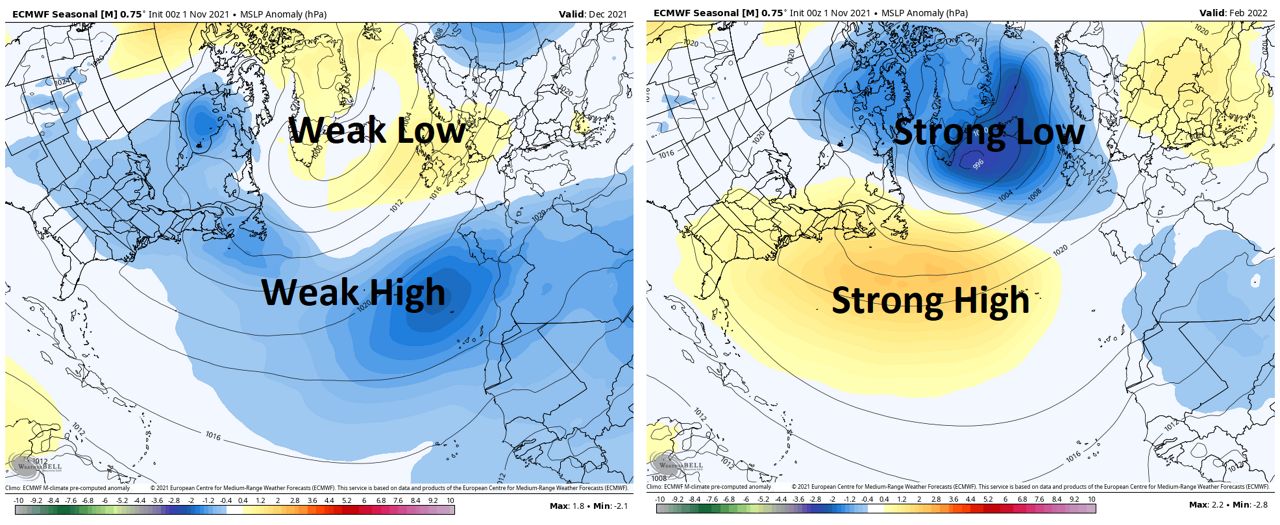
Moreover, we’ll have better chances for blocking and cold air intrusions early in the season compared to later in the season.
Of course, there are other auxiliary teleconnections we can look at such as the Arctic Oscillation (AO), the Pacific North American Pattern (PNA) and the Madden-Julian Oscillation (MJO). However, the three mentioned above tend to have a larger impact on our winter weather patterns.
Looking at the 2021-2022 winter season
To be statistically accurate, anything within two degrees of the average temperature is considered average, while anything within five inches of the average snowfall is considered average.
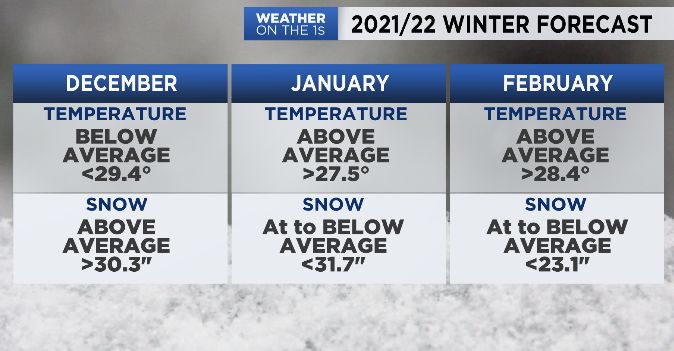
Because of it being a weak to moderate La Niña year, much of the forecast will depend on the status of the NAO.
Since the NAO is expected to be more negative in December, we can expect colder than average temperatures as a result of cold air intrusions. This combined with a wide-open Lake Erie could also lead to above-average snowfall.
With the NAO trending progressively more positive during the months of January and February, we predict that the last two-thirds of the season will be warmer than normal with less snow than typically seen on average.
With warmer weather expected late in the season, this could be another winter where Lake Erie does not freeze over.
No matter what winter ultimately holds, we’ll always be here to provide you with the latest forecast. Please feel free to reach out to me on Twitter @Dan_Weather_Man or email me at dan.russell@charter.com for any additional questions.
Have a happy, safe and healthy winter!