


When you tune in to Weather on the 1s, you will probably hear us talk about the "average high" or "average low" for a given day.
While some refer to these figures as "normals" or "where we should be for this time of year," I prefer to say "average," because that's what these numbers truly, mathematically, are.
We get the average temperatures, as well as average precipitation amounts, from a 30-year set of data that is recalculated every ten years. Therefore, the averages have all been updated recently for the period from 1991 to 2020.
There are some striking trends within these numbers versus the previous set.
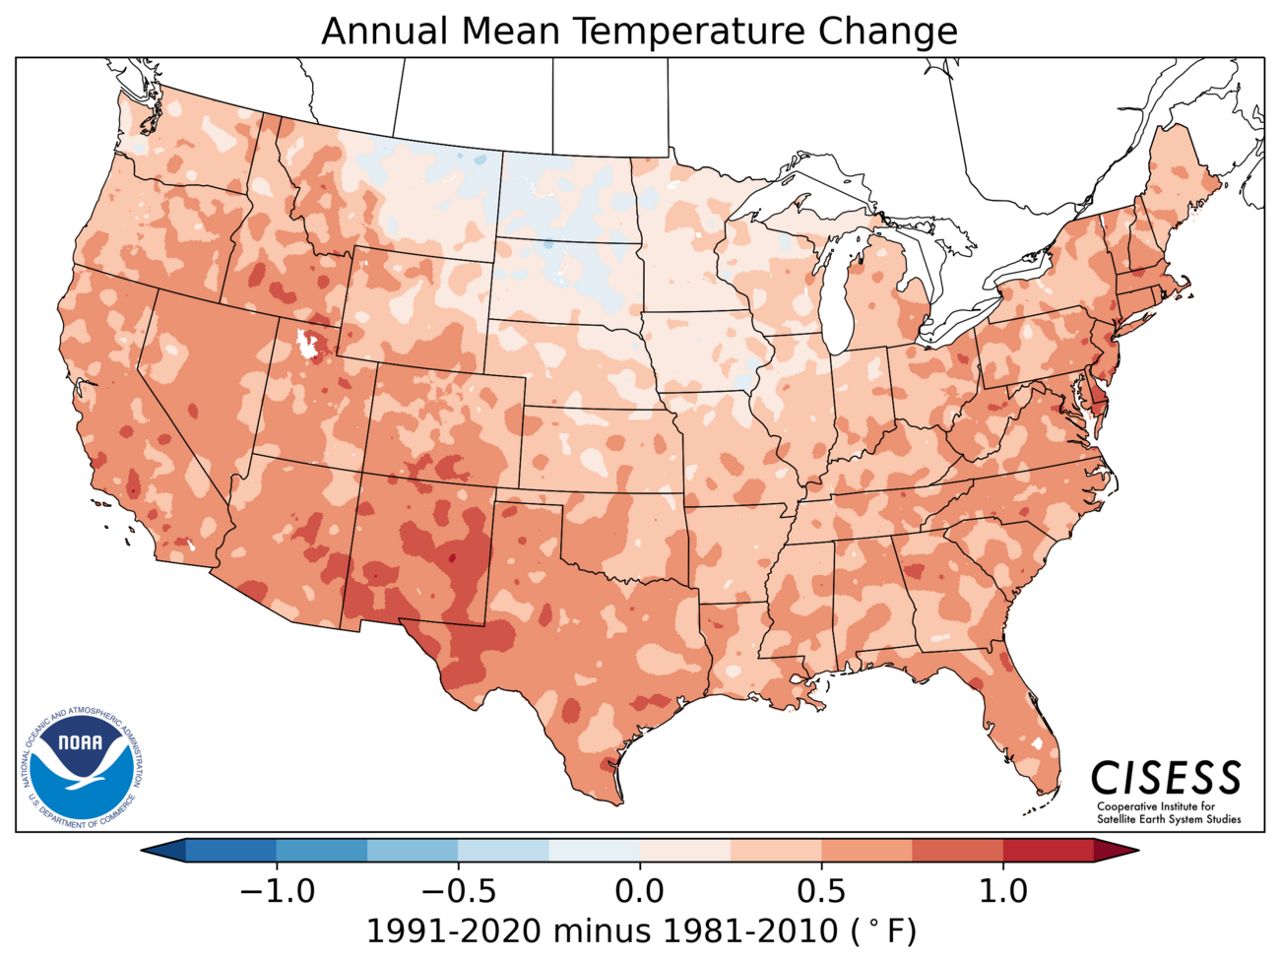
Source: NOAA
As is noted from the map above, average temperatures have indeed increased with the new set of data compared to the last set from 1981 to 2010.
This is yet another sign of our changing climate, and in effect, a "new normal."
When looking at each climatological (30-year) period going back to 1901 and comparing each set of averages to the overall 1901-2000 average, the warming trend becomes more alarming.
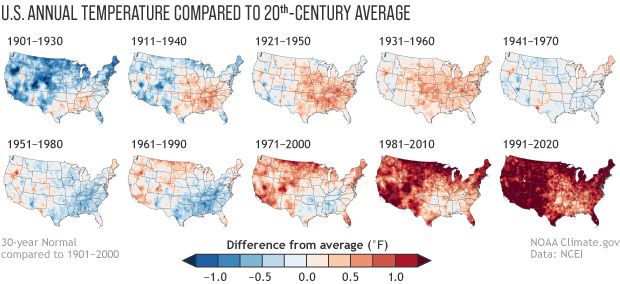
Source: NOAA
The precipitation trend we get from looking at the new versus old averages is also striking.
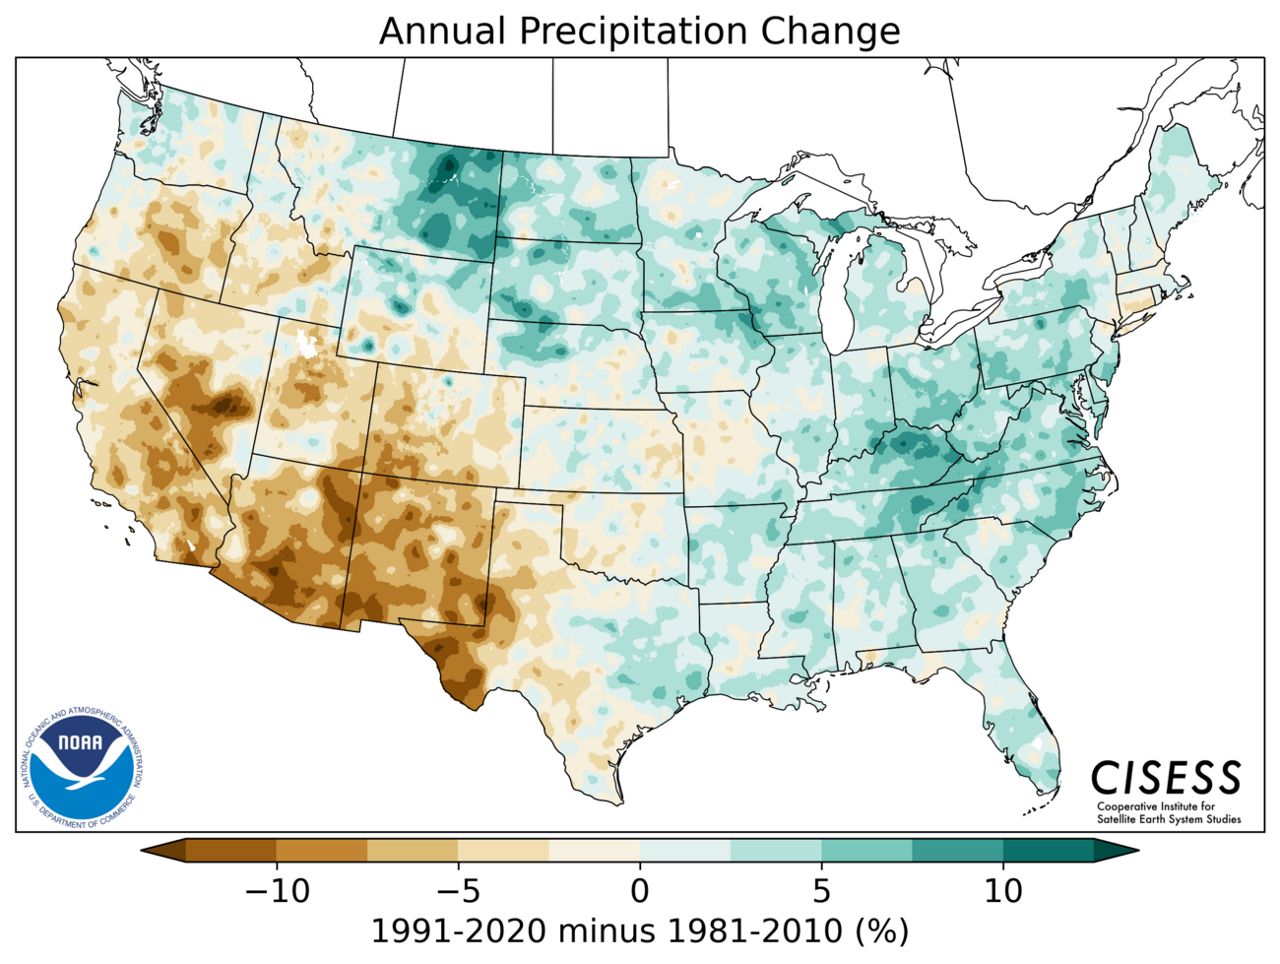
Source: NOAA
Consider that a large part of the eastern two-thirds of the country has been seeing more precipitation, while oft-wildfire-stricken parts of the west are continuing to get drier.
Let's see what the new set of averages tells us about the climate here at home in Syracuse.
For eight out of the twelve months in the year, our average temperatures have gotten warmer versus the last set of data from 1981 to 2010.
The months that did not warm only experienced cooler readings by a fraction of a degree each.
One interesting trend is that while January's average temperatures have warmed, months that cooled included February, March, and April.
This may be a sign that a seasonal shift is taking place. Colder, wintry weather is potentially being extended into spring.
We certainly have at least some proof of that, because we have seen snow as late as May for two years in a row now.
The average precipitation amounts have also increased for all but two months out of the year.
The average amount of snowfall here in the Salt City has increased from 123.8 inches to 127.8 inches.
Keep in mind again that these data are based on 30 years. Just because this winter or any winter falls below average does not mean that the entire data set of averages gets knocked down.
So what is the takeaway from all of this?
According to NOAA, "climate normals provide the baseline for comparing U.S weather and climate to the recent past, providing context for decisions in multiple economic sectors, including agriculture, energy production, and construction."
We have yet another statistics-based example that our climate is indeed warming and changing.
Warmer, wetter conditions are being experienced as the years go by, and are impacting people and industry here at home and around the world.
Knowing that the last seven years have been the warmest seven recorded on Earth if the trend prevails as expected, many years in the 2020s will probably become some of the warmest as well.
You can get a full breakdown of the new climate numbers for Syracuse and many other cities across the United States here.