


We all know this has been a very warm summer across our region.
From tying a record for second-longest heat wave, to experiencing the longest stretch of 80-degree-plus heat since 1949, to seeing an earlier-than-average first 90-degree day, it has been a season for the record books.
Recently, we have gotten a break from the heat and humidity we have seen so often over the past several weeks.
As we wait to see if summer 2020 will be one of the warmest on record, let’s take a look at one of the metrics we use to see just how much heat we see during the season: how many 90 degree days we have had versus the average and records.
Central New York
So far this year in Syracuse, we have had 19 days where the high temperature has been 90 degrees or higher, the hottest being a high of 98 on July 9. In an average year, just nine days feature a high temperature that reaches at least 90 degrees.
North Country
Watertown has recorded seven 90 degree days so far this year. In an average year, Watertown sees only three days where the high temperature reaches 90 degrees or greater.
Southern Tier
Binghamton hasn’t seen nearly as many 90 degree days as Syracuse or Watertown, with only two recorded so far this year. This is also the average number of 90 degree days we see in a year.
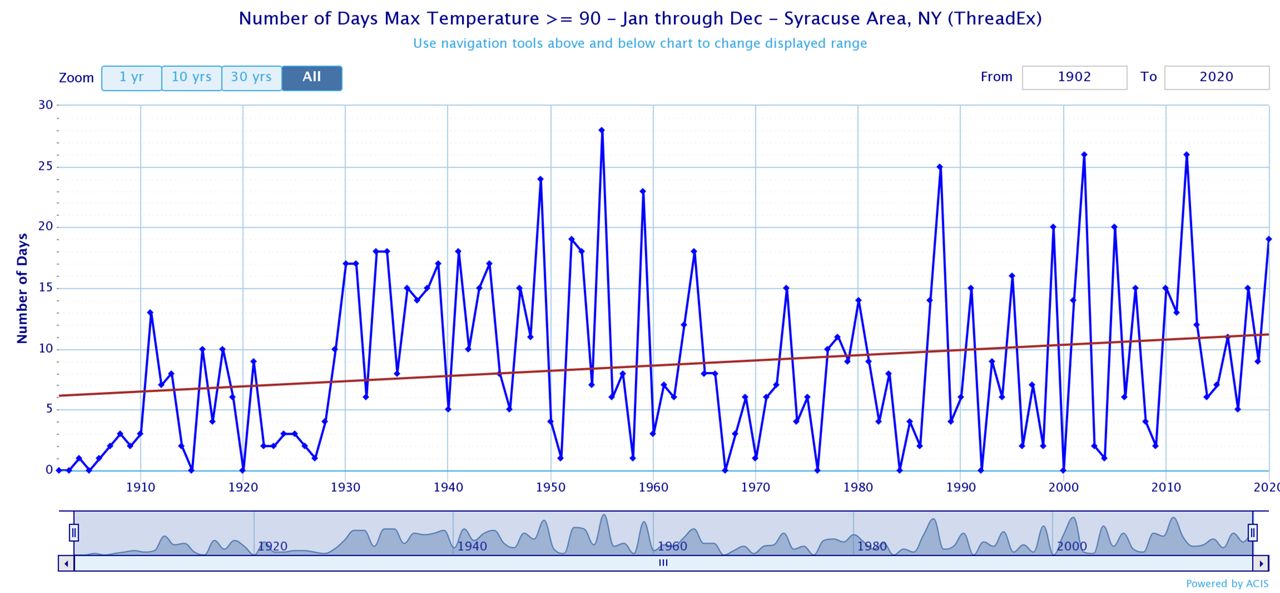
The most 90 degree days ever recorded in Syracuse in a single year was 28 back in 1955. In Watertown, the most was 15 that same year, and 13 in Binghamton in 1988.
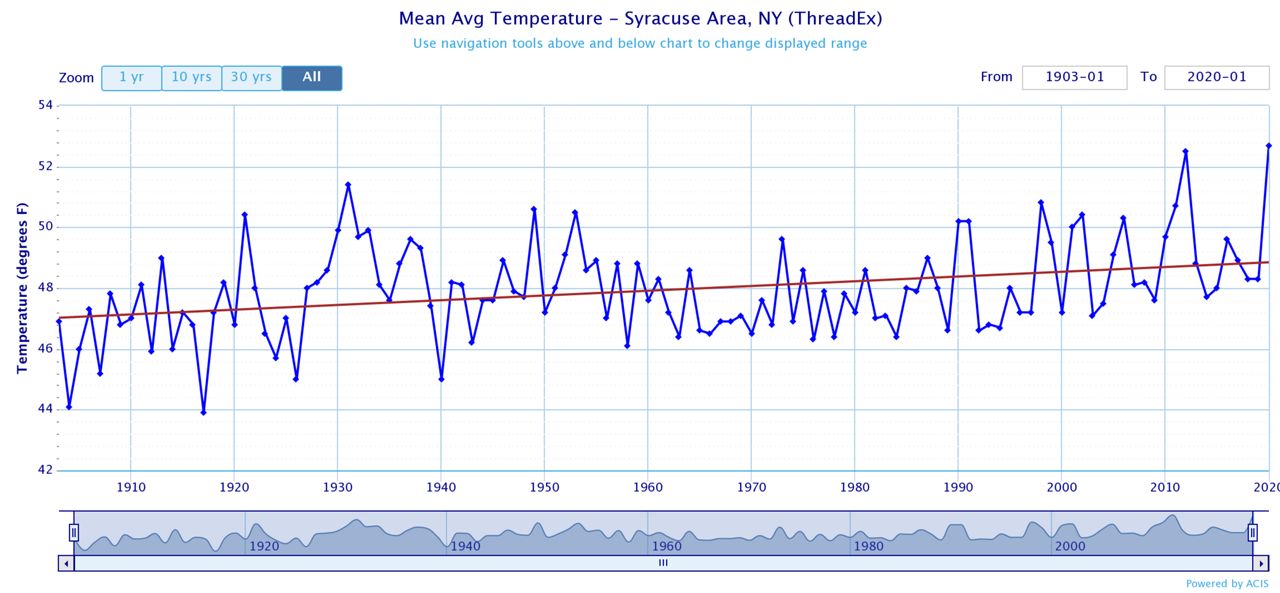
There also appears to be a trend consistent with our changing and warming climate. The red line in the graph below represents the average mean temperature trend for the duration of record-keeping in Syracuse, which is clearly increasing (warming) through the years.
Taking a look at the number of 90 degree days each year, this is also a visible upward trend. Our temperatures are warming, as are the number of days with the most extreme warmth.
As we approach the end of meteorological summer and flip the page to meteorological fall on September 1, all eyes are on the daily temperature data to see if summer 2020 will in fact end up one of the warmest on record. Currently, we are in the top five, and it looks like we may stay there based on the forecast.
Warmest Summers in Syracuse (data as of August 19, 2020)
Despite the records we have set and tied this summer, we have yet to hit 100 degrees. With a little bit of summer left, we will see if we can reach the century mark, and also if we can remain near the top of the list of warmest summers.