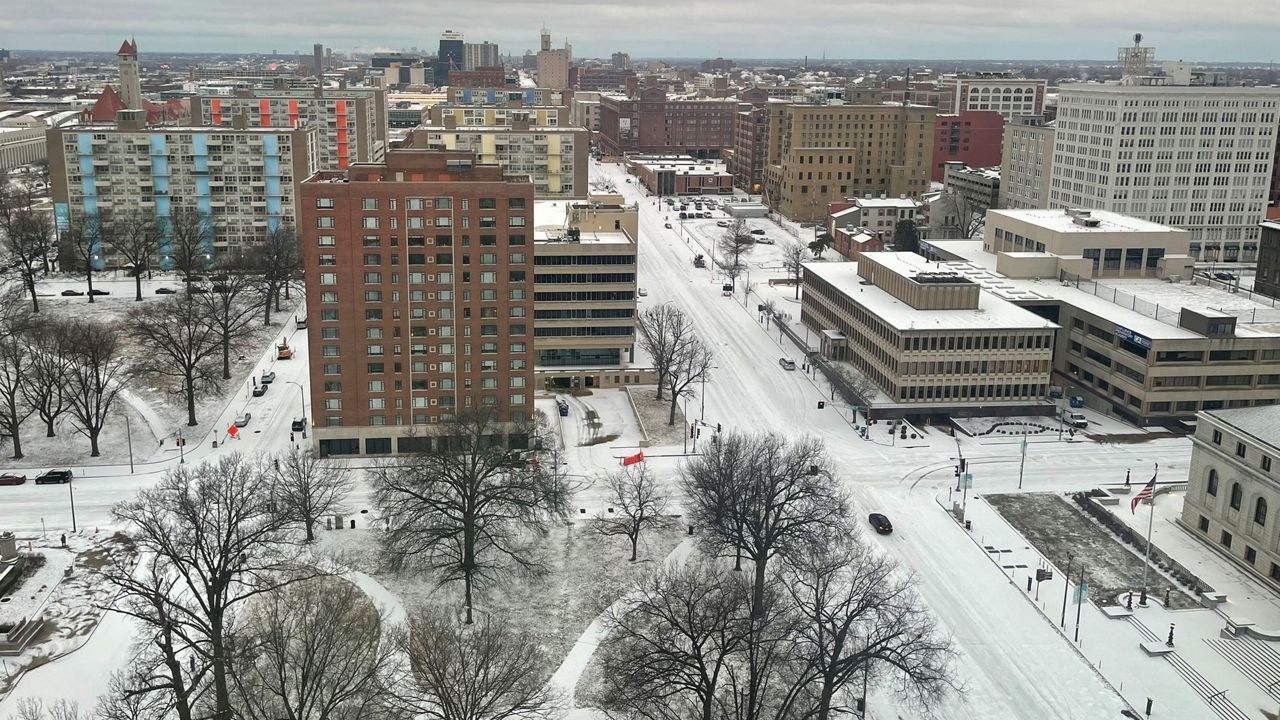
The National Weather Service (NWS) in St. Louis recently held a Winter Climatology and Seasonal Outlook session to discuss the area’s local winter climatology and what may happen in the coming months.
On average, the St. Louis area receives around 16 inches of snow per season, based on historical data from 1991 to 2020. Snow typically occurs anytime from November through March.
NWS meteorologist Matt Beitscher used data over the past 40 years to explain trends. One interesting point about accumulating snow in the area involves a storm’s track.
The best chance for accumulating snow in the St. Louis metro will come from systems passing to our south that track from the southwest to the northeast. Dubbed “I-44 storms,” 58% of winter storms from 1980 to 2021 have followed this path.
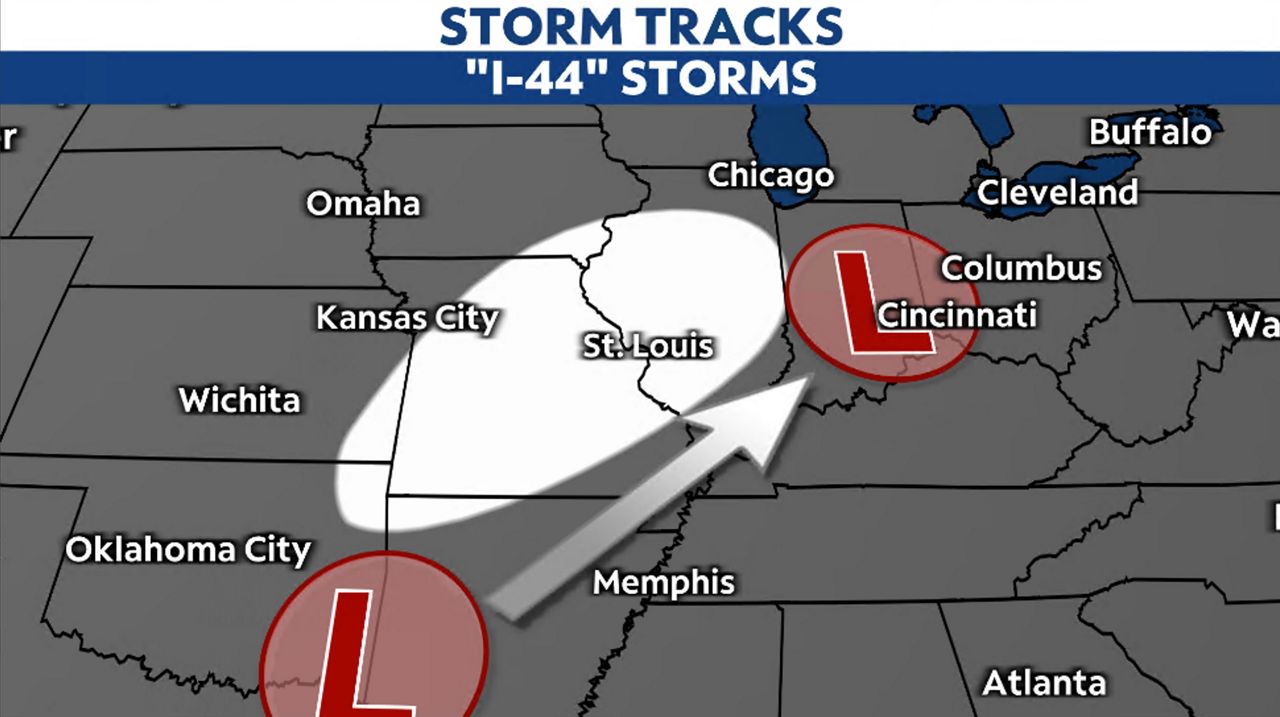
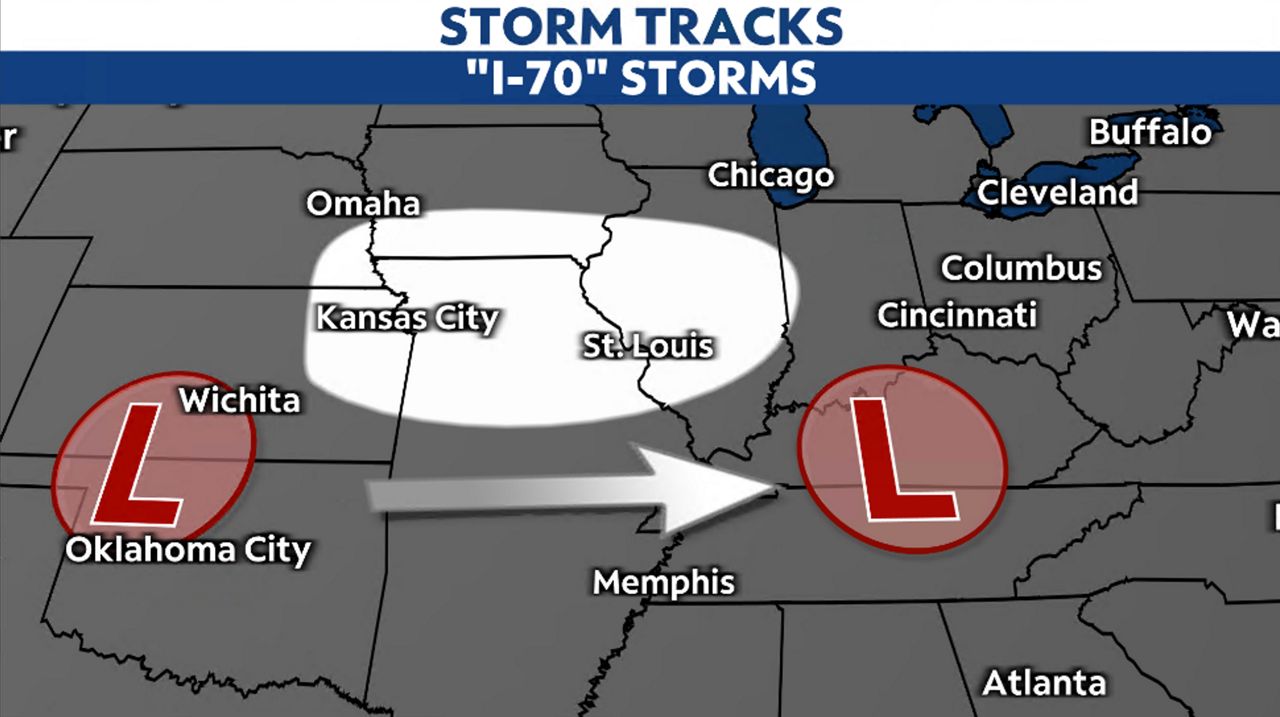
Compare these storms to the “I-70 storms,” or west-to-east tracking storms, which account for about 37% of accumulating snow storms in the area.
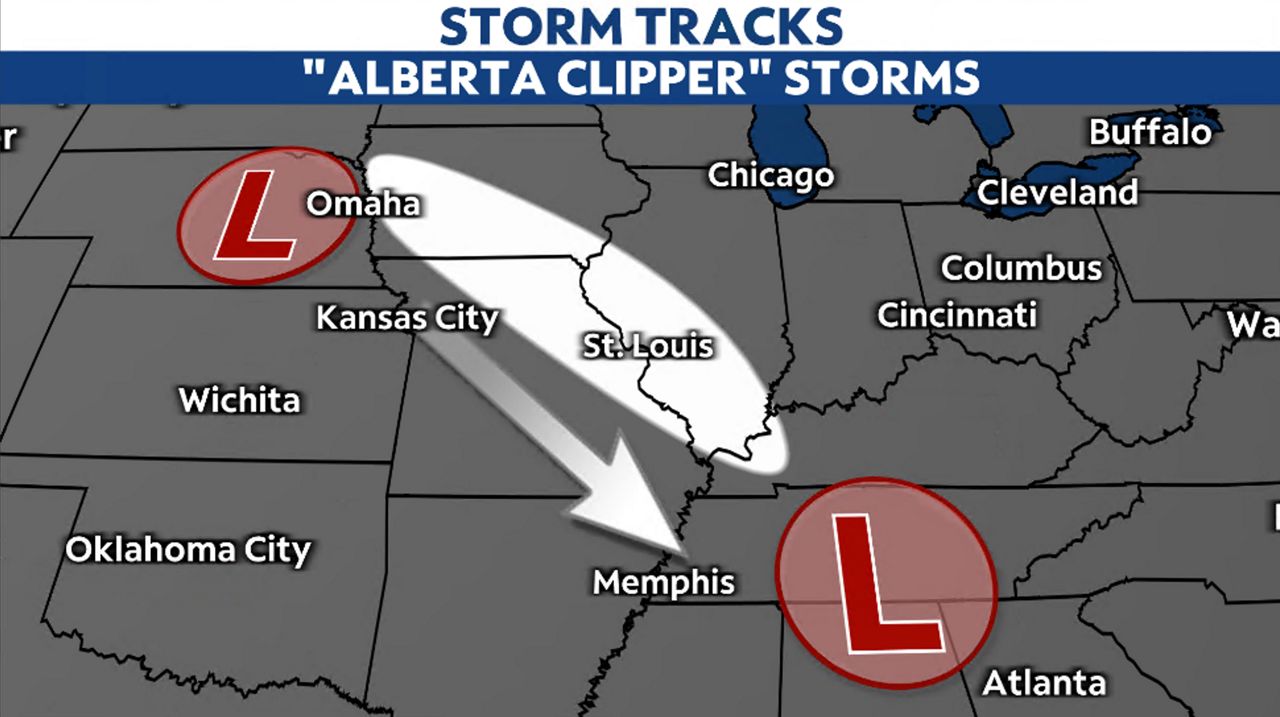
The least likely storms for snow accumulation in the area stem from “Alberta clippers,” named for the region in Canada where they originate. These storms travel from northwest to southeast across the region and account for just 3% of all accumulating storms, producing only light snow.
As for ice storms–ice accumulating over 0.25”–the St. Louis area can expect an ice storm every other year. The decade encompassing the 2000s saw an impressive eight ice storms. Last year recorded no ice storms.
Overall, January racks up the most ice events. Based on just this information, an ice event has a higher likelihood of occurring this upcoming season.
Beitscher explained that a heavy snow event (6 inches or more of snow) in the region typically happens annually, with two to three types of storms. However, over the past decade, the data has seen a decline in these “big” storms and over the past 40 years, storms of this intensity have decreased by 17%.
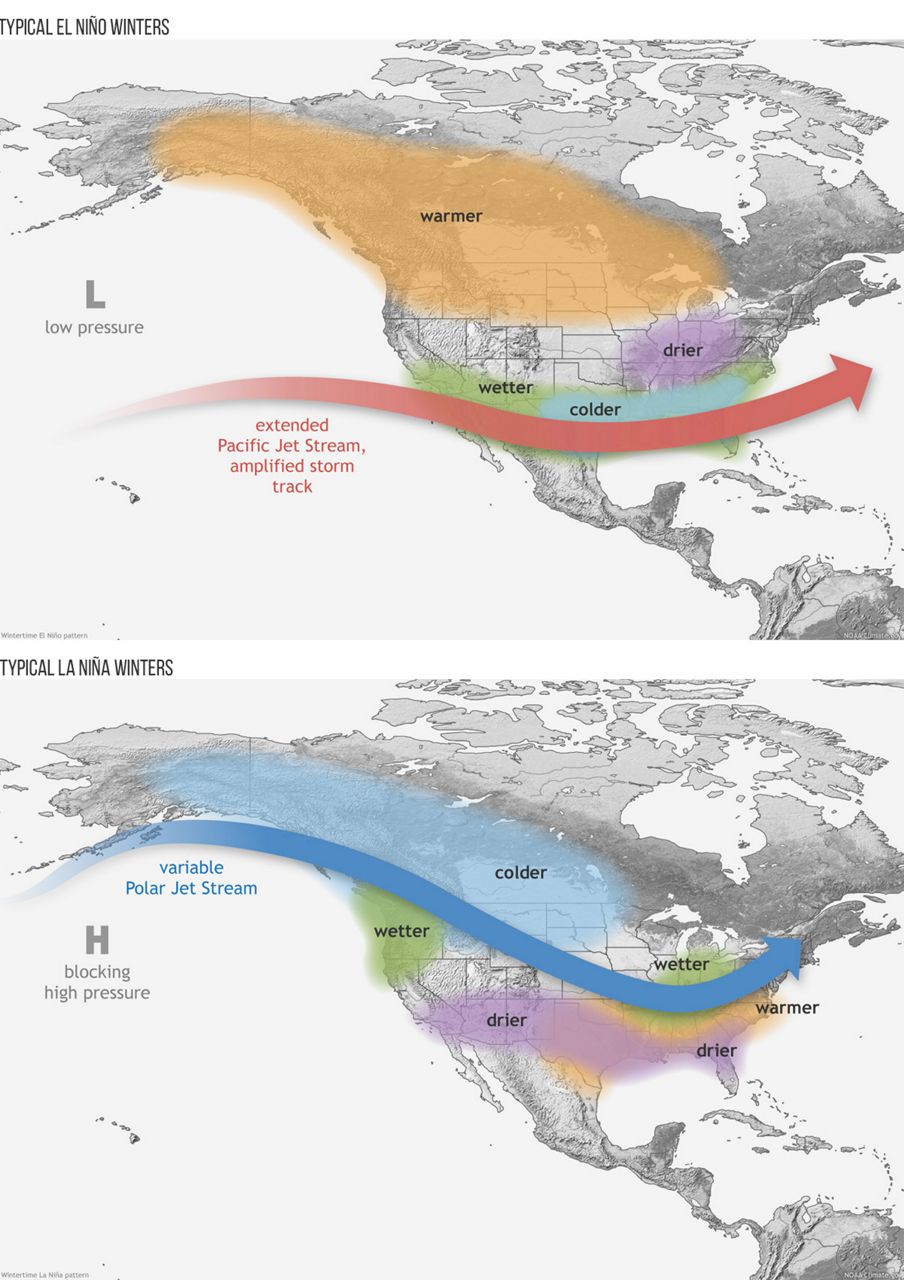
Forecasters making seasonal outlooks include recent trends and ENSO patterns, like El Niño and La Niña. However, ENSO only accounts for about 6% of the observed weather in St. Louis, meaning our location doesn't show a strong signal one way or the other if it will be colder and drier or warmer and wetter.
Climatologically, January and February are the snowiest months of winter.
Last winter saw 15 inches of snow, close to average.
Beitscher and his team used historical trends and expected patterns to make their forecast. Based on this information, December and January will be warmer and wetter than average, probably ending up rainier with lower chances of winter storms.
As for February, Beitscher says it may be “colder than average with near normal precipitation, but it is our best chance for winter storms, snow and extreme cold."
Our team of meteorologists dives deep into the science of weather and breaks down timely weather data and information. To view more weather and climate stories, check out our weather blogs section.


